Data Representations
Data Representations
A dot plot is a graphical display of data using dots. It is very similar to pictographs.
A frequency table is a table that shows a set of numbers/scores and their frequency (how many times each one occurs).
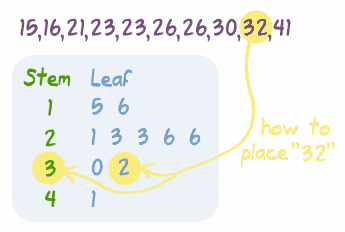
A stem-and-leaf plot is a plot where each data value is split into a "leaf" (usually the last digit) and a "stem" (the other digits). For example "32" is split into "3" (stem) and "2" (leaf). The "stem" values are listed down, and the "leaf" values are listed next to them. This way the "stem" groups the scores and each "leaf" indicates a score within that group.

Here are the basic steps to creating a stem-and-leaf plot:
Here are some videos about these data representations:
Here are some activities that you can do to practice these skills:
Please let me know if you have any questions!

Comments
Post a Comment